Ice Management eXtension and Metrics
IceMX, introduced with Ice 3.5, stands for Ice Management eXtensions. This facility provides metrics information for your Ice processes, such as how many invocations are dispatched on a server, the number of threads currently in use, and the amount of data going through Ice connections.
In this article, we'll explore the concepts behind IceMX metrics and show how to access them with the IceGrid Admin graphical tool and the metrics demo (written in Python). We'll also explain the metrics provided by Ice services such as Glacier2 and IceStorm.
On this page:
IceMX Concepts
The Ice Instrumentation facility
IceMX metrics are built on top of the Ice instrumentation facility API. This instrumentation API provides everything required to instrument the Ice core. It also deprecates the old Ice::Stats interface that was used to gather connection statistics.
We won't discuss the details of this API here. However you should know that it is used by the IceMX metrics administrative facet to gather metrics for the Ice core. You can provide your own callbacks to the instrumentation API and as a result disable IceMX metrics.
Metrics
A metric is a measurement associated with a given system. For example, it can be the number of bytes sent by a connection or the time it took for an invocation to return. IceMX provides access to many metrics that are gathered by the Ice run time. The Ice run time records these metrics in objects that are themselves stored into collections called metrics maps.
A metrics map is a collection of metrics of the same kind or, to put it another way, metrics in the same map all record metrics for the same kind of object. For example, the "Connection" metrics map is a collection of metrics measuring various aspects of Ice connections.
Metrics maps of different kinds are themselves grouped into metrics views. As an example, a metrics view can be composed of the "Connection" metrics map and the "Dispatch" metrics map.
Now that we have defined the concepts of IceMX metrics, let's see how we can get hold of them.
The Metrics administrative facet
The Ice administrative facility provides an administrative Ice object. This object has a number of facets:
- the "Properties" facet to get and set Ice properties at runtime
- the "Process" facet to allow shutting down the Ice process or write messages on the standard output or error
- the "Metrics" facet to retrieve metrics.
We'll focus on the "Metrics" facet here and we'll also briefly discuss the "Properties" facet as it can be useful to update the IceMX configuration at run time.
The "Metrics" facet implements the the IceMX::MetricsAdmin Slice interface, defined in the slice/Ice/Metrics.ice file included with your Ice distribution. Here is the definition of this interface:
interface MetricsAdmin {
    Ice::StringSeq getMetricsViewNames(out Ice::StringSeq disabledViews);

    void enableMetricsView(string name) throws UnknownMetricsView;

    void disableMetricsView(string name) throws UnknownMetricsView;

    MetricsView getMetricsView(string view, out long timestamp) throws UnknownMetricsView;

    MetricsFailuresSeq getMapMetricsFailures(string view, string map) throws UnknownMetricsView;

    MetricsFailures getMetricsFailures(string view, string map, string id) throws UnknownMetricsView;
}
The interface provides the following functionality:
- get the list of configured enabled and disabled views
- enable and disable a view at run time
- get the metrics for a given view
- get the metrics failures for a given map or the metrics failures of a specific metrics object.
A metrics map is defined as a sequence of metrics:
sequence<Metrics> MetricsMap;
All the metrics in the map are instances of the same Slice class. This class can be the IceMX::Metrics base class or a specialization. For example, the "Invocation" metrics map contains instances of the IceMX::InvocationMetrics class. The definition of the IceMX::Metrics class is shown below:
class Metrics {
    string id;
    long total = 0;
    int current = 0;
    long totalLifetime = 0;
    int failures = 0;
};
This class provides the following information:
- the identifier of the monitored object(s)
- the total number of monitored object(s)
- the current number of active monitored object(s)
- the total lifetime of all the monitored objects
- the number of failures that occurred for the monitored object(s).
Finally, a metrics view is defined as a dictionary of metrics maps:
dictionary<string, MetricsMap> MetricsView;
The key correponds to the name of the metrics map. Here is the list of metrics maps available with the Ice core and Ice services:
| Provider | Map name | Slice class | Description |
|---|---|---|---|
| Ice | Connection | IceMX::ConnectionMetrics | Connection metrics. |
| Ice | Thread | IceMX::ThreadMetrics | Thread metrics. The Ice run time instruments threads for the communicator's thread pools as well as threads used internally. |
| Ice | Invocation | IceMX::InvocationMetrics | Client-side proxy invocation metrics. |
| Ice | Dispatch | IceMX::DispatchMetrics | Server-side dispatch metrics. |
| Ice | EndpointLookup | IceMX::Metrics | Endpoint lookup metrics. For tcp, ssl and udp endpoints, this corresponds to the DNS lookups made to resolve the host names in endpoints. |
| Ice | ConnectionEstablishment | IceMX::Metrics | Connection establishment metrics. |
| IceStorm | Topic | IceMX::TopicMetrics | IceStorm topic metrics, including the number of messages published or forwarded on the topic. |
| IceStorm | Subscriber | IceMX::SubscriberMetrics | IceStorm subscriber metrics provides information on the number of queued, outstanding and delivered messages for the subscriber. |
| Glacier2 | Session | IceMX::SessionMetrics | Glacier2 session metrics provides information for each session on the number of queued, forwarded and overridden messages for both the client and server side. |
Configuration
Now that we have described the different data structures of the IceMX metrics facility, you might wonder how this data is actually collected. Take for example the connection metrics class shown below:
class ConnectionMetrics extends Metrics {
    long receivedBytes = 0;
    long sentBytes = 0;
}
Is the received and sent bytes collected per connection? Or, like the now-deprecated Ice::Stats interface, is it collected for all the connections associated with the Ice communicator?
As you might imagine, since we provide a metrics map (a sequence of metrics), it's possible to collect the information separately. But how? The answer to this question is simple: you specify how through configuration. The IceMX GroupBy property allows you to specify how the measurements from one or several monitored objects will be grouped together into a single metrics. For example, you can decide to collect connection metrics based on the protocol ("tcp" or "ssl"), or based on the parent of the connection (the communicator for "client" connections or the object adapter for "server" connections). You can also decide to collect metrics for each connection or globally for the whole Ice communicator.
The string id member of the IceMX::Metrics base class identifies the monitored object or set of objects that are contributing measurements to the metrics. How this identifier is computed is also defined through configuration, using the same GroupBy property.
The GroupBy property isn't the only property to configure the collection of metrics; you can also setup Accept and Reject properties to filter which objects contribute to metrics. For example, you can restrict the collection of metrics to only "tcp" connections or connections from a given object adapter.
The IceMX properties also allow you to define metrics views. As described earlier, a metrics view is a collection of metrics maps. For instance, a given metrics view can contain a single Connection metrics map. Another view can be configured with all the available metrics maps where each map contains metrics information grouped by object adapter or protocol.
Furthermore, a view can easily be disabled or enabled. This allows you to configure multiple views and only enable those views when needed. As you can imagine, collecting metrics isn't without a cost and, although we went to great lengths to minimize the overhead of metrics collection, it still has a small cost. It can therefore be useful to disable some metrics views by default and only enable them if you need to diagnose some aspects of your Ice application.
So let's examine the configuration of a few metrics views.
In order to collect very fine grained metrics you can use the following view named Debug:
IceMX.Metrics.Debug.GroupBy=id
The value of the GroupBy property here is id. By definition, the value of the GroupBy property is a list of attributes delimited by any character other than alpha-numeric or the period character. The id attribute is a special attribute that is defined for all metrics maps and identifies the monitored object. The id attribute for connections is substituted with a string having the following pattern:
localHost:localPort -> remoteHost:remotePort <[connectionId]>
For invocations, id is substituted with:
identity <proxy options> [operation]
In general, the id attribute allows us to uniquely identify the monitored object and therefore allows us to record very detailed metrics.
Other attributes are also available and you can even combine them when defining the GroupBy property. And remember, the GroupBy property is also used to define the value of the id member of metrics. It's not only for grouping measurements of several objects into a metrics. For example, if you want to define a view with only Connection metrics where the connection metrics are grouped by protocol and parent, you can set the following property to define a ConnectionPerProtocol view:
IceMX.Metrics.ConnectionPerProtocol.Map.Connection.GroupBy=parent-endpointType
The view will contain a single Connection metrics map containing one metrics object per parent and endpoint type combination. Like the id attribute, the parent attribute is a special attribute that is defined for all types of metrics maps and identifies the parent of the monitored object. For a connection, the parent is either the object adapter or the communicator. For server connections, parent is substituted with the name of the object adapter, and for client connections it is substituted with Communicator.
You can also define a view to group metrics by remote host. For example:
IceMX.Metrics.PerHost.GroupBy=remoteHost
This metrics view will contain metrics maps for which the remoteHost attribute is a valid attribute and each map will contain a metrics object for each remote host. So all the metrics for connections, dispatch, and so on from a given remote host will be grouped into the same metrics object.
To restrict the set of objects monitored with metrics you can use Reject and Accept properties, as shown below:
IceMX.Metrics.DebugWithoutAdmin.GroupBy=id
IceMX.Metrics.DebugWithoutAdmin.Reject.parent=Ice\.Admin

IceMX.Metrics.SayHelloOperation.Accept.operation=sayHello
In the DebugWithoutAdmin view, metrics related to the Ice.Admin object adapter won't be monitored, which excludes metrics related to the Ice administrative facility. In the SayHelloOperation view, we record metrics for objects that have an operation attribute whose value is sayHello.
Now that we know how to configure metrics views, it's time to see how those metrics look with two clients: the metrics client from the Python metrics demo and the IceGrid Admin graphical tool from your Ice distribution. The Python client dumps metrics as text tables whereas with IceGrid Admin you can visualize metrics as tables and graphics.
Run time configuration
The Metrics administrative facet configuration can be changed at run time, meaning you can add or remove views, change the grouping or filtering properties, and enable or disable views at run time. This allows you to start monitoring an Ice application even if it wasn't initially configured for monitoring. For this to work, you still need to ensure the Ice.Admin administrative facility is enabled and ensure the Properties facet is enabled (it is by default so this shouldn't be a problem unless you explicitly disabled it).
Note that the configuration of an additional view, or enabling an existing view, can impact the performance of your Ice application. This is especially true in the case of connection metrics. Consider the case of a server that has 30,000 incoming connections established. If you enable a metrics view that provides a Connection metrics map, the Ice run time must go through the 30,000 connections to collect the information for this new Connection metrics map. If you are only interested in dispatch metrics, you should configure the view to only measure metrics for dispatch by configuring the Dispatch metrics map (with the IceMX.Metrics.<view name>.Map.Dispatch.GroupBy property).
The Python metrics demo
You can find the Ice for Python metrics demo in:
- the
py/demo/Ice/metricsdirectory of your Ice source distribution or - the
demopy/Ice/metricsdirectory of your Ice demo distribution.
The demo is an Ice for Python client that connects to the Ice administrative facility of an Ice client or server to retrieve its metrics views and display them as text tables. The views are obtained by calling on the Metrics facet described earlier.
Using the Python client
The Metrics.py script supports the following command-line interface:
usage: ./Metrics.py dump | enable | disable [<view-name> [<map-name>]]
To connect to the Ice administrative facility of an Ice process, you
should specify its endpoint(s) and instance name with the
`InstanceName' and `Endpoints' properties. For example:

 $ ./Metrics.py --Endpoints="tcp -p 12345 -h localhost" --InstanceName=Server dump
Commands:
  dump    Dump all the IceMX metrics views configured for the
          process or if a specific view or map is specified,
          print only this view or map.
  enable  Enable all the IceMX metrics views configured for
          the process or the provided view or map if specified.
  disable Disable all the IceMX metrics views configured for
          the process or the provided view or map if specified.
The script allows dumping, enabling and disable metrics views. You must provide the Endpoints and InstanceName properties as well to specify the Ice process to connect to.
The Ice/hello demo configuration files specify two metrics views. Let's see how the output of Metrics.py looks for this demo. First, you need to enable the Ice administrative facility in the hello client and server by un-commenting the Ice.Admin.Enpoints property in their configuration files. Change to the Ice/hello demo directory of your favorite language mapping and edit the config.server and config.client files:
#
# IceMX configuration.
#
Ice.Admin.Endpoints=tcp -h localhost -p 10002
Ice.Admin.InstanceName=server
IceMX.Metrics.Debug.GroupBy=id
IceMX.Metrics.ByParent.GroupBy=parent
#
# IceMX configuration.
#
Ice.Admin.Endpoints=tcp -h localhost -p 10003
Ice.Admin.InstanceName=client
IceMX.Metrics.Debug.GroupBy=id
IceMX.Metrics.ByParent.GroupBy=parent
As you can see, the configuration files already define two views for the client and server, one view to get detailed metrics and another one where metrics are grouped by parent (object adapter or communicator).
Start the client and server according to the README file in the demo directory. Try out the demo by sending a few greetings using the different modes. Don't exit the client or shutdown the server, we first want to obtain the metrics from these two Ice applications!
Change to the Python Ice/metrics demo directory and execute the following command to dump the client metrics:
$ ./Metrics.py --Endpoints="tcp -h localhost -p 10003" --InstanceName="client" dump
For server metrics execute this command:
$ ./Metrics.py --Endpoints="tcp -h localhost -p 10002" --InstanceName="server" dump
We use the value of the Ice.Admin.Endpoints property to define the Endpoints property of the Metrics.py client and the Ice.Admin.InstanceName to define the InstanceName property.
Here's the output of the ByParent view for both the client and the server:
| Client | Server |
|---|---|
+==============================+===+=====+========+ |Endpoint Lookups | #|Total|Avg (ms)| +==============================+===+=====+========+ |Communicator | 0| 6| 0.539| +==============================+===+=====+========+ +=========================+===+=====+======+======+======+========+ |Threads | #|Total| IO| User| Other| Avg (s)| +=========================+===+=====+======+======+======+========+ |Communicator | 2| 2| 0| 0| 0| 0.000| |Ice.ThreadPool.Client | 1| 1| 0| 0| 0| 0.000| |Ice.ThreadPool.Server | 1| 1| 0| 1| 0| 0.000| +=========================+===+=====+======+======+======+========+ +========================================+===+=====+========+ |Dispatch | #|Total|Avg (ms)| +========================================+===+=====+========+ |Ice.Admin | 1| 35| 0.074| +========================================+===+=====+========+ +===================================+===+=====+==========+==========+========+ |Connections | #|Total| RxBytes| TxBytes| Avg (s)| +===================================+===+=====+==========+==========+========+ |Communicator | 3| 4| 101| 703| 60.010| |Ice.Admin | 1| 3| 2988| 5948| 0.015| +===================================+===+=====+==========+==========+========+ +=================================================+===+=====+=======+========+ |Invocations | #|Total|Retries|Avg (ms)| +=================================================+===+=====+=======+========+ |Communicator | 0| 19| 0| 1.408| | Communicator| 0| 14| | 0.113| +=================================================+===+=====+=======+========+ +==============================+===+=====+========+ |Connection Establishments | #|Total|Avg (ms)| +==============================+===+=====+========+ |Communicator | 0| 4| 4.943| +==============================+===+=====+========+ | +===================================+===+=====+==========+==========+========+ |Connections | #|Total| RxBytes| TxBytes| Avg (s)| +===================================+===+=====+==========+==========+========+ |Hello | 3| 4| 517| 101| 60.008| |Ice.Admin | 1| 1| 218| 68| 0.000| +===================================+===+=====+==========+==========+========+ +=========================+===+=====+======+======+======+========+ |Threads | #|Total| IO| User| Other| Avg (s)| +=========================+===+=====+======+======+======+========+ |Communicator | 2| 2| 0| 0| 0| 0.000| |Ice.ThreadPool.Client | 1| 1| 0| 0| 0| 0.000| |Ice.ThreadPool.Server | 1| 1| 0| 1| 0| 0.000| +=========================+===+=====+======+======+======+========+ +========================================+===+=====+========+ |Dispatch | #|Total|Avg (ms)| +========================================+===+=====+========+ |Hello | 0| 16| 0.025| |Ice.Admin | 1| 3| 0.029| +========================================+===+=====+========+ |
As expected, the Debug view output shown below provides more detailed information:
| Client | Server |
|---|---|
+==============================+===+=====+========+ |Endpoint Lookups | #|Total|Avg (ms)| +==============================+===+=====+========+ |ssl -h localhost -p 10001 | 0| 3| 0.696| |tcp -h localhost -p 10000 | 0| 2| 0.293| |udp -h localhost -p 10000 | 0| 1| 0.562| +==============================+===+=====+========+ +=========================+===+=====+======+======+======+========+ |Threads | #|Total| IO| User| Other| Avg (s)| +=========================+===+=====+======+======+======+========+ |Ice.GC | 1| 1| 0| 0| 0| 0.000| |Ice.HostResolver | 1| 1| 0| 0| 0| 0.000| |Ice.ThreadPool.Client-0 | 1| 1| 0| 0| 0| 0.000| |Ice.ThreadPool.Server-0 | 1| 1| 0| 1| 0| 0.000| +=========================+===+=====+======+======+======+========+ +========================================+===+=====+========+ |Dispatch | #|Total|Avg (ms)| +========================================+===+=====+========+ |client/admin [getMapMetricsFailures] | 0| 30| 0.030| |client/admin [getMetricsViewNames] | 0| 3| 0.030| |client/admin [getMetricsView] | 1| 6| 0.356| |client/admin [ice_isA] | 0| 3| 0.029| +========================================+===+=====+========+ +===================================+===+=====+==========+==========+========+ |Connections | #|Total| RxBytes| TxBytes| Avg (s)| +===================================+===+=====+==========+==========+========+ |127.0.0.1:10003 -> 127.0.0.1:58273 | 0| 1| 1385| 2283| 0.019| |127.0.0.1:10003 -> 127.0.0.1:58285 | 0| 1| 1385| 3597| 0.012| |127.0.0.1:10003 -> 127.0.0.1:58288 | 1| 1| 838| 969| 0.000| |127.0.0.1:56528 -> 127.0.0.1:10000 | 1| 1| 0| 228| 0.000| |127.0.0.1:58232 -> 127.0.0.1:10000 | 0| 1| 26| 70| 60.010| |127.0.0.1:58283 -> 127.0.0.1:10000 | 1| 1| 25| 170| 0.000| |127.0.0.1:58284 -> 127.0.0.1:10001 | 1| 1| 50| 235| 0.000| +===================================+===+=====+==========+==========+========+ +=================================================+===+=====+=======+========+ |Invocations | #|Total|Retries|Avg (ms)| +=================================================+===+=====+=======+========+ |flushBatchRequests | 0| 3| 0| 0.138| | tcp -h localhost -p 10000| 0| 3| | 0.011| | udp -h localhost -p 10000| 0| 2| | 0.040| |hello -D -e 1.1 [sayHello] | 0| 5| 0| 0.114| |hello -O -e 1.1 [sayHello] | 0| 2| 0| 0.230| |hello -d -e 1.1 [sayHello] | 0| 1| 0| 0.183| | udp -h localhost -p 10000| 0| 1| | 0.037| |hello -o -e 1.1 [sayHello] | 0| 1| 0| 0.172| | tcp -h localhost -p 10000| 0| 1| | 0.036| |hello -o -s -e 1.1 [sayHello] | 0| 3| 0| 6.606| | ssl -h localhost -p 10001| 0| 3| | 0.058| |hello -t -e 1.1 [ice_isA] | 0| 1| 0| 2.351| | tcp -h localhost -p 10000| 0| 1| | 0.277| |hello -t -e 1.1 [sayHello] | 0| 1| 0| 1.858| | tcp -h localhost -p 10000| 0| 1| | 0.259| |hello -t -s -e 1.1 [sayHello] | 0| 2| 0| 0.466| | ssl -h localhost -p 10001| 0| 2| | 0.346| +=================================================+===+=====+=======+========+ +==============================+===+=====+========+ |Connection Establishments | #|Total|Avg (ms)| +==============================+===+=====+========+ |127.0.0.1:10000 | 0| 3| 0.319| |127.0.0.1:10001 | 0| 1| 18.814| +==============================+===+=====+========+ | +===================================+===+=====+==========+==========+========+ |Connections | #|Total| RxBytes| TxBytes| Avg (s)| +===================================+===+=====+==========+==========+========+ |127.0.0.1:10000 -> 127.0.0.1:58232 | 0| 1| 70| 26| 60.008| |127.0.0.1:10000 -> 127.0.0.1:58283 | 1| 1| 170| 25| 0.000| |127.0.0.1:10000 -> :0 | 1| 1| 42| 0| 0.000| |127.0.0.1:10001 -> 127.0.0.1:58284 | 1| 1| 235| 50| 0.000| |127.0.0.1:10002 -> 127.0.0.1:58290 | 1| 1| 551| 653| 0.000| +===================================+===+=====+==========+==========+========+ +=========================+===+=====+======+======+======+========+ |Threads | #|Total| IO| User| Other| Avg (s)| +=========================+===+=====+======+======+======+========+ |Ice.GC | 1| 1| 0| 0| 0| 0.000| |Ice.HostResolver | 1| 1| 0| 0| 0| 0.000| |Ice.ThreadPool.Client-0 | 1| 1| 0| 0| 0| 0.000| |Ice.ThreadPool.Server-0 | 1| 1| 0| 1| 0| 0.000| +=========================+===+=====+======+======+======+========+ +========================================+===+=====+========+ |Dispatch | #|Total|Avg (ms)| +========================================+===+=====+========+ |hello [ice_isA] | 0| 1| 0.039| |hello [sayHello] | 0| 15| 0.024| |server/admin [getMapMetricsFailures] | 0| 3| 0.028| |server/admin [getMetricsViewNames] | 0| 1| 0.030| |server/admin [getMetricsView] | 1| 2| 0.146| |server/admin [ice_isA] | 0| 1| 0.028| +========================================+===+=====+========+ |
The demo also shows failures that are recorded with metrics. For example, with the hello client you can simulate a timeout by setting a timeout on the proxy and having the server delay its sending of the response. The client invocation in this case fails with an Ice::TimeoutException and the underlying connection used for the invocation is closed. When this occurs, the Metrics.py script shows the failures on the server and client side. So let's try to make the following invocations on the hello server with the hello client:
==> t
Hello World!
==> t
Hello World!
==> T
timeout is now set to 2000ms
==> t
Hello World!
==> t
Hello World!
==> P
server delay is now set to 2500ms
==> t
-! 12/05/12 09:50:04.315 ./client: warning: connection exception:
   Outgoing.cpp:227: Ice::TimeoutException:
   timeout while sending or receiving data
   local address = 127.0.0.1:53178
   remote address = 127.0.0.1:10000
Hello World!
-! 12/05/12 09:50:04.817 ./server: warning: connection exception:
   TcpTransceiver.cpp:237: Ice::ConnectionLostException:
   connection lost: Connection reset by peer
   local address = 127.0.0.1:10000
   remote address = 127.0.0.1:53178
-! 12/05/12 09:50:06.820 ./client: warning: connection exception:
   Outgoing.cpp:227: Ice::TimeoutException:
   timeout while sending or receiving data
   local address = 127.0.0.1:53179
   remote address = 127.0.0.1:10000
Outgoing.cpp:227: Ice::TimeoutException:
timeout while sending or receiving data
==> Hello World!
-! 12/05/12 09:50:07.320 ./server: warning: connection exception:
   TcpTransceiver.cpp:237: Ice::ConnectionLostException:
   connection lost: Connection reset by peer
   local address = 127.0.0.1:10000
   remote address = 127.0.0.1:53179
Here's the output of the Metrics.py script for the relevant parts of the Debug view:
| Client | Server |
|---|---|
+===================================+===+=====+==========+==========+========+ | +===================================+===+=====+==========+==========+========+ |
On the client side, we can see that two connections failed with an Ice::TimeoutException and that the sayHello invocation was called five times:
- 2 times on the connection without the timeout set
- 2 times with the timeout set but the delay not set
- 1 time with both the timeout and the delay set
The sayHello invocation was retried once following the timeout exception, so while the number of invocations on the proxy is five, under the hood Ice sent or tried to send the invocation a total of six times (two times on the connection with the endpoint tcp -h localhost -p 10000 and four times on connections with the endpoint tcp -h localhost -p 10000 -t 2000).
On the server side, the metrics show two Ice::ConnectionLostException failures, which are the result of the client timeout exceptions: the client forcefully closes the connection following the timeout.
Reviewing the Python code
To retrieve metrics maps, the Metrics.py client needs to connect to the Ice administrative facility of the target Ice application. It creates a proxy that points to the endpoint specified by the target's Ice.Admin.Endpoints property with an identity category matching the target's Ice.Admin.InstanceName property:
#
# Create the proxy for the Metrics admin facet.
#
proxyStr = "%s/admin -f Metrics:%s" % (props.getProperty("InstanceName"), props.getProperty("Endpoints"))
metrics = IceMX.MetricsAdminPrx.checkedCast(self.communicator().stringToProxy(proxyStr));
if not metrics:
	print(sys.argv[0] + ": invalid proxy `" + proxyStr + "'")
        return 1
This proxy is then cast to a proxy implementing the IceMX::MetricsAdmin interface presented earlier. Once we have this proxy, retrieving metrics maps is easy. First, we retrieve the list of configured views:
(views, disabledViews) = metrics.getMetricsViewNames()
This allows checking whether or not the view specified by the user on the command line is configured and enabled:
# Ensure the view exists
if not viewName in views and not viewName in disabledViews:
    print "unknown view `" + viewName + "', available views:"
    print "enabled = " + str(views) + ", disabled = " + str(disabledViews)
    return 0
# Ensure the view is enabled
if viewName in disabledViews:
    print "view `" + viewName + "' is disabled"
    return 0
Next, if the user specified a metrics map parameter, we only print the requested metrics map, otherwise we print the metrics view:
# Retrieve the metrics view and print it.
(view, refresh) = metrics.getMetricsView(viewName);
if mapName:
    if not mapName in view:
        print "no map `" + mapName + "' in `" + viewName + "' view, available maps:"
        print str(view.keys())
        return 0
    printMetricsMap(metrics, viewName, mapName, view[mapName])
else:
    printMetricsView(metrics, viewName, (view, refresh))
If the user didn't specify any metrics view or map on the command line, we print all of the enabled metrics views:
# Print all the enabled metrics views.
for v in views:
    printMetricsView(metrics, v, metrics.getMetricsView(v))
Printing a metrics view consists of iterating over the metrics view dictionary to print each metrics map:
def printMetricsView(admin, viewName, (view, refreshTime)):
    #
    # Print each metrics map from the metrics view.
    #
    print "View: " + viewName
    print
    for mapName, map in view.items():
        if mapName in maps and len(map) > 0:
            printMetricsMap(admin, viewName, mapName, map)
            print
A metrics map is a sequence of metrics objects, so to print the metrics map we iterate over the sequence of metrics objects:
for o in map:
    printMetrics(mapName, metricsField(o))
Note that we handle the printing of the Invocation map differently. The Invocation map contains instances of IceMX::InvocationMetrics objects, and these objects themselves contain metrics maps. So for invocation metrics, we also print the remotes sub-metrics maps:
first = True
for o in map:
    if not first:
        printMetrics(mapName, metricsSeparator('-'), '+')
    printMetrics(mapName, metricsField(o))
    for so in o.remotes:
        printMetrics("Remote", metricsField(so))
Next, the printing of the metrics map table also prints the failures that are associated with each of the metrics from the map. To retrieve the failures, we call getMapMetricsFailure on the IceMX::MetricsAdmin object and we iterate over the sequence of IceMX::MetricsFailure structures to print the failures as a list.
The Slice definition of IceMX::MetricsFailure is shown below:
struct MetricsFailures
{
    string id;
    StringIntDict failures;
};
And here's the code to print the metrics failures:
#
# Print metrics failure if any after the table.
#
failures = admin.getMapMetricsFailures(viewName, mapName)
if len(failures) > 0:
    print
    print " Failures:"
    for k in failures:
        for (exception, count) in k.failures.items():
            if len(k.id) > 0:
                print " - " + str(count) + ' ' + exception + " for `" + k.id + "'"
            else:
                print " - " + str(count) + ' ' + exception
Finally, here's the code to print a metrics (a row of the table):
def printMetrics(mapName, getValue, sep = '|', prefix = " "):
    #
    # This method prints a metrics, a line in the table.
    #
    # It concatenates all the metric fields according to the format
    # described in the `maps' table defined above. The value of each
    # column is obtained by calling the provided getValue function.
    #
    fieldStr = [ prefix + sep ]
    for (field, title, align, width) in maps[mapName]:
        fieldStr.append(getValue(mapName, field, title, align, width) + sep)
    print "".join(fieldStr)
This is how the columns of the table are formatted and joined to produce a row. The printMetrics method uses the given lambda function to get the value of the column, which can return either the value of a metrics member (such as received bytes) or simply a separator character. The text is formatted according to formatting options defined in the global maps table, which also specifies the columns that are printed.
You can use this script as a basis for your own script to retrieve metrics. For example, you could write a script to retrieve on a regular basis the metrics of an Ice application and exploit those metrics with a management platform such as Nagios or OpenNMS.
If you use IceGrid, another option is to use IceGrid Admin to monitor metrics for servers managed by IceGrid. IceGrid Admin provides access to metrics through tables similar to the ones produced by the Metrics.py script, but it also enables the creation of graphs to monitor metrics in real time and graph a metrics value over time. This will be the focus of the next section.
The IceGrid Admin Graphical Tool
We will use the IceGrid/simple demo to demonstrate metrics support in the IceGrid Admin graphical tooI. Please follow the instructions provided with your Ice installation to build and run the demo. To connect IceGrid Admin to the demo IceGrid instance, see Connection to an IceGrid Registry. The IceGrid registry from the IceGrid/simple demo is listening on the loopback interface (localhost) and on the TCP/IP port 4061.
Once you are connected, you should see the following run time components assuming you deployed the application.xml descriptor:
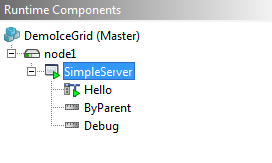
The application.xml descriptor configures two metrics view, ByParent and Debug. Those views are shown under the SimpleServer node in the run time components tree above. Here's the relevant configuration from the application.xml descriptor:
<server id="SimpleServer" exe="./server" activation="on-demand">
  <adapter name="Hello" endpoints="tcp -h localhost">
    <object identity="hello" type="::Demo::Hello" property="Identity"/>
  </adapter>
  <property name="IceMX.Metrics.Debug.GroupBy" value="id"/>
  <property name="IceMX.Metrics.Debug.Disabled" value="1"/>
  <property name="IceMX.Metrics.ByParent.GroupBy" value="parent"/>
  <property name="IceMX.Metrics.ByParent.Disabled" value="1"/>
</server>
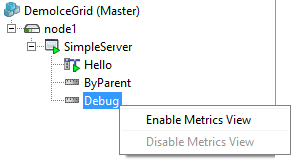
As you can see in the configuration, the views are disabled by default. To enable a view at run time with IceGrid Admin, right click on the view icon and choose "Enable Metrics View":
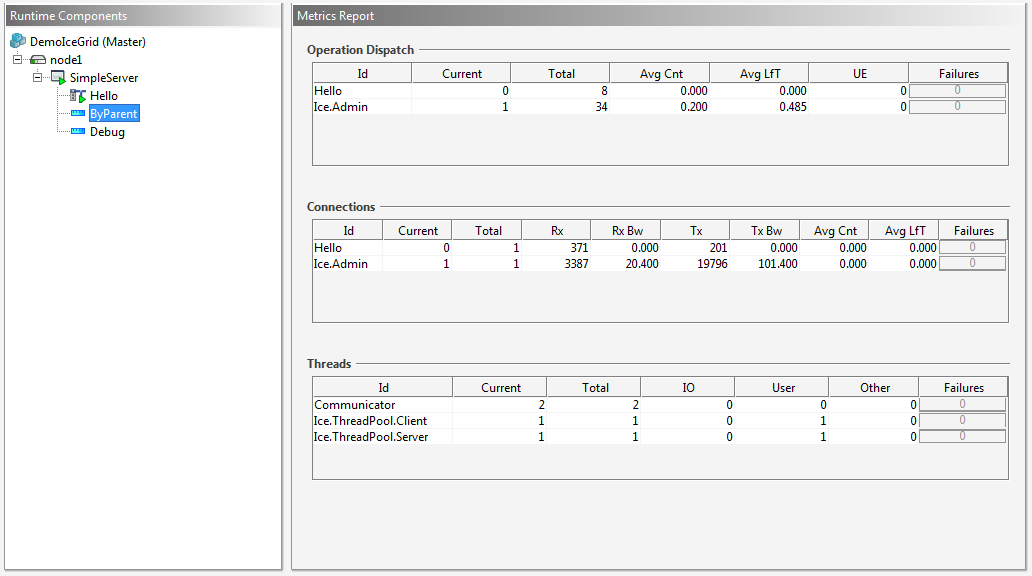
Once enabled, the metrics view starts recording metrics and IceGrid Admin shows the configured metrics maps when clicking on the view icon. Here are the metrics maps for the ByParent view:
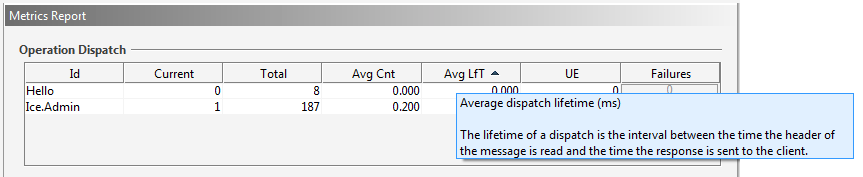
And here's the Debug view with more detailed information:
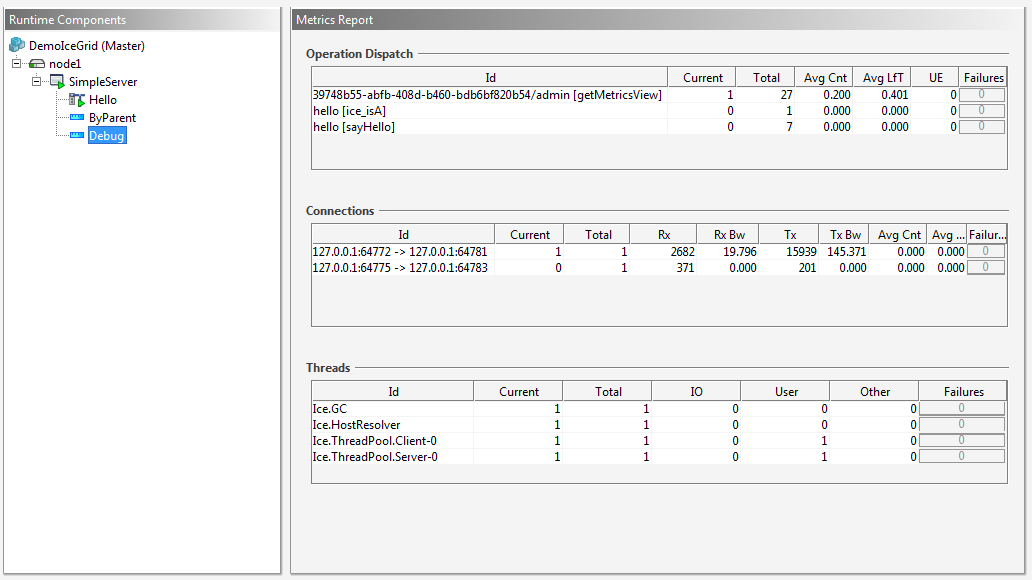
The information provided here is similar to the console tables produced by the Python metrics demo. The maps shown in IceGrid Admin provide additional information however. For example, IceGrid Admin doesn't just display the total number of bytes received or sent over a connection; it also computes the read and write bandwidth of the Ice connection. Furthermore, it displays the average count of connections, invocations, and dispatches, as well as the average lifetime of these objects. In order to get more information on a metric, you can just mouse over the column title to show the tooltip, which describes how the value is computed and its unit. For example:
It's also possible to monitor metrics with graphs. To create a new graph window, choose File -> New -> Metrics Graph or right click on a metrics value in one of the metrics maps and choose Add to Metrics Graph->New Metrics Graph. Once you have created a metrics graph window, you can add more metrics values using drag and drop from the metrics map tables to the graph window or by choosing Add to Metrics Graph in the contextual menu of the metrics value.
Here's an example graph created to monitor a few metrics:
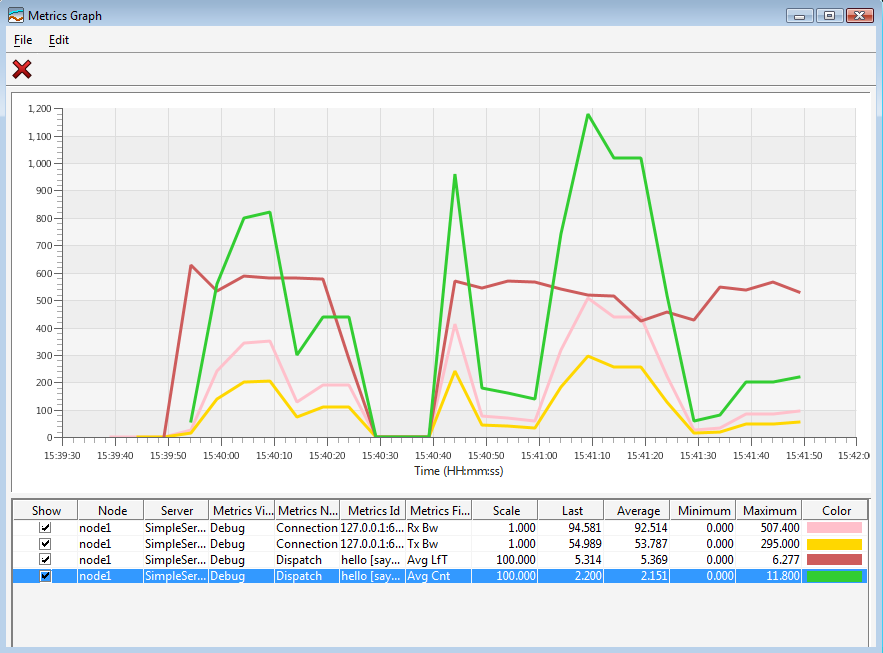
For each of the metrics added to the graph, you have the option of configuring the scale for the values shown in the graph. This is useful if you want to monitor values that don't have the unit. You can also remove a metric by clicking on the corresponding row in the table below the graph and choose Edit->Delete or click on the delete button in the toolbar. You can also edit the color of the metric by clicking on the color of the metric in the table.
Finally, IceGrid Admin makes it very easy to update the metrics configuration for managed servers. For example, let's see how to add configuration to filter out the metrics related to the Ice.Admin facility. In IceGrid Admin, choose File->Open->Application from Registry and choose the Simple application. (You can also access the application descriptor using the toolbar Open application from registry button or by clicking on the View/Edit this application button in the tab shown when you click on the server node in the run time components tree.)
Once the Simple application is opened, click on the SimpleServer icon and add the following Reject property:
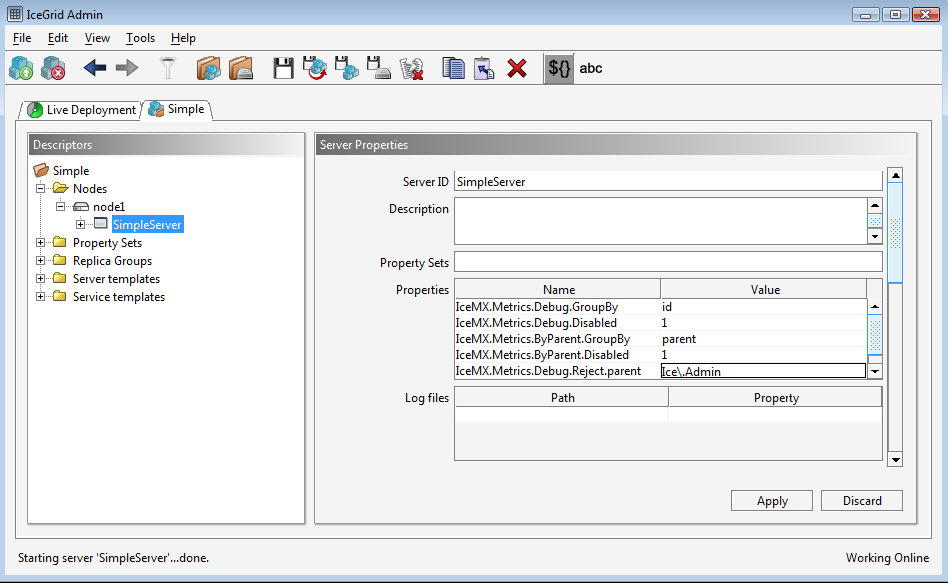
This property excludes metrics for objects whose parent attribute matches the Ice.Admin regular expression. Once the property is added, click on the Apply button and save the changes to the registry using the Save to registry (no server restart) button:
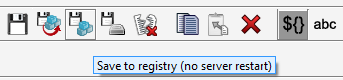
This will update the server's configuration at run time without restarting it. Now, check the metrics maps of the SimpleServer Debug view and you should see that metrics related to the Ice.Admin facility are no longer being recorded. Here we just modified the filtering of an existing view but it's also possible to add and remove metrics views, or configure specific maps on the metrics views.